About WebSTR
Getting started
1. Searching for STRs
To get started, from the WebSTR homepage, pick a genome assembly version in the dropdown. WebSTR currently stores some datasets that are only mapped to the hg19/GRCh37 coordinates. The default value is hg38 and corresponds to Ensembl version GRCh38.p2. You can search for STRs by entering one of the following into the search bar:
- A gene name (e.g., PCSK9 or RFT1)
- An Ensembl identifier (e.g., ENSG00000169174 or ENSG00000163933)
- A genomic region using the syntax chrom:start-end (e.g., 22:46615715-46625880).
2. Region pages
A valid search will take you to a region-level page. The top of this page displays the exon/intron structure of genes in the region. Arrows next to the gene names represent the template strand of the gene. Each dot represents an STR in the region, color-coded by the motif length (gray=homopolymer, red=dinucleotide, gold=trinucleotide, blue=tetranucleotide, green=pentanucleotide, and purple=hexanucleotide). Hovering over an STR will display the coordinates and motif. Clicking an STR will take you to the STR page for that locus.
The bottom of the page displays a table of all STRs identified in the region. It includes the coordinates, motif sequence, and length of the repeat in the reference genome.
3. STR pages
STR pages (e.g. see example) provide locus-level information gathered from various genome-wide studies. By default, the sequence of the STR (red) and its genomic context (black, +/- 120bp) are shown. Other data panels (Expression STRs, Mutation and constraint, and STR imputation) can be displayed or hidden by clicking on the respective black title boxes. These panels are described below.
Programmatic access - WebSTR API
We provide programmatic assess to the data using a RESTful API, documentation on available endpoints is available on the main page: http://webstr-api.ucsd.edu/docs. For some example queries to get you started, check out our Getting Started Guide on github.
Available datasets
| Panel alias | Human Genome Assembly Version | Annotation Method | Genotyping Methods | STRs | Cohorts | Samples | Available Data |
|---|---|---|---|---|---|---|---|
| ensembletr_hg38 | GRCh38.p2 | TRF | EnsembleTR ExpansionHunter GangSTR HipSTR |
1,710,833 total reference panel with allele frequency data available 35,998 1,133,225 1,331,280 |
1000Genomes/H3Africa | 3,550 | Allele frequencies |
| gangstr_crc_hg38 | GRCh38.p2 | TRAL | GangSTR | 1,548,993 Reference STRs 219,394 were found to have at least 1 variation call in the dataset 81,262 STRs have reliable variation data |
Sinergia-CRC | 412 | Average variation of the number of repeat units in the dataset |
| hipstr_hg19 | GRCh37 | TRF | HipSTR | ~1.6 million | GTEx SSC 1000Genomes SGDP |
652 1,916 150 300 |
Allele frequencies,trait associations, imputation metrics, mutation parameters |
STR pages feature datasets from the following studies:
EnsembleTR Panel (Jam et al.2023)
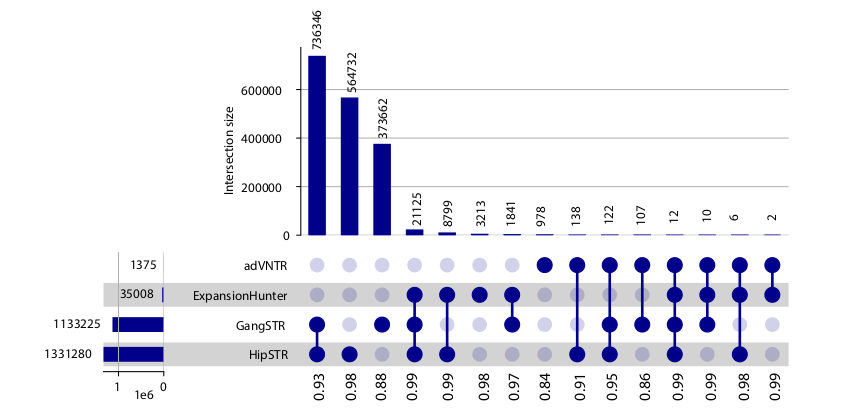
This STR reference panel is based on the GRCh38 reference assembly and represents a combined set of TRs genotyped by four separate methods (HipSTR, GangSTR, ExpansionHunter, and AdVNTR) on the 1000 Genomes Project and H3Africa data. We applied EnsembleTR to jointly genotype all samples, which resulted in consensus calls at 1,782,302 unique TRs on autosomal chromosomes. After removing TRs called in fewer than 75% of samples, 1,711,093 TRs remained. Of those, 55% were only genotyped by a single method, largely reflecting differences in TR reference sets published for each tool. Finally, we generated a phased reference haplotype panel of SNPs/short indels and TRs from the 1000GP samples. We used our previously published pipeline to phase each TR separately onto a backbone of phased SNPs in a +/-50kb window, resulting in a single panel containing both phased SNPs and TRs. The resulting panel contains a total of 1,089,670 TRs.
Allele frequencies are available for this dataset. Allele frequency is defined as the number of copies of the allele in a population divided by the sum of all alleles in a population.
Sinergia-CRC (TCGA cohort) Panel - gangstr_crc_hg38 (Manuscript in preparation)
For this reference panel we used statistical framework TRAL to find 1,5 mln STRs in the human reference genome located in the proximity of genes (promoter, exon and intron regions). The Sinergia-CRC repeats have then been genotyped using GangSTR on more than 400 genomes from patients with colorectal cancer available to us through the TCGA consortium. This project is part of a larger effort "Trans-omic approach to colorectal cancer: an integrative computational and clinical perspective" funded by a SNSF Sinergia grant.
Cohort-level summary statistics describing locus-level patterns of genetic variation is stored in the WebSTR database and is publicly available for each STR. The following parameters can be accessed:
- avg_size_diff: the average amount of repeat units difference that was found for this locus between healthy and tumor sample
- total_calls: the total number of patients where the locus was called in both the healthy and tumor sample.
- frac_variable: the fraction of patients where a difference in repeat size was observed between healthy and tumor for this locus. Calculated by dividing the number of patients with variable loci by total_calls
Earlier studies (mapped to hg19)
1. Expression STRs (eSTRs) (Fotsing et al. 2019)
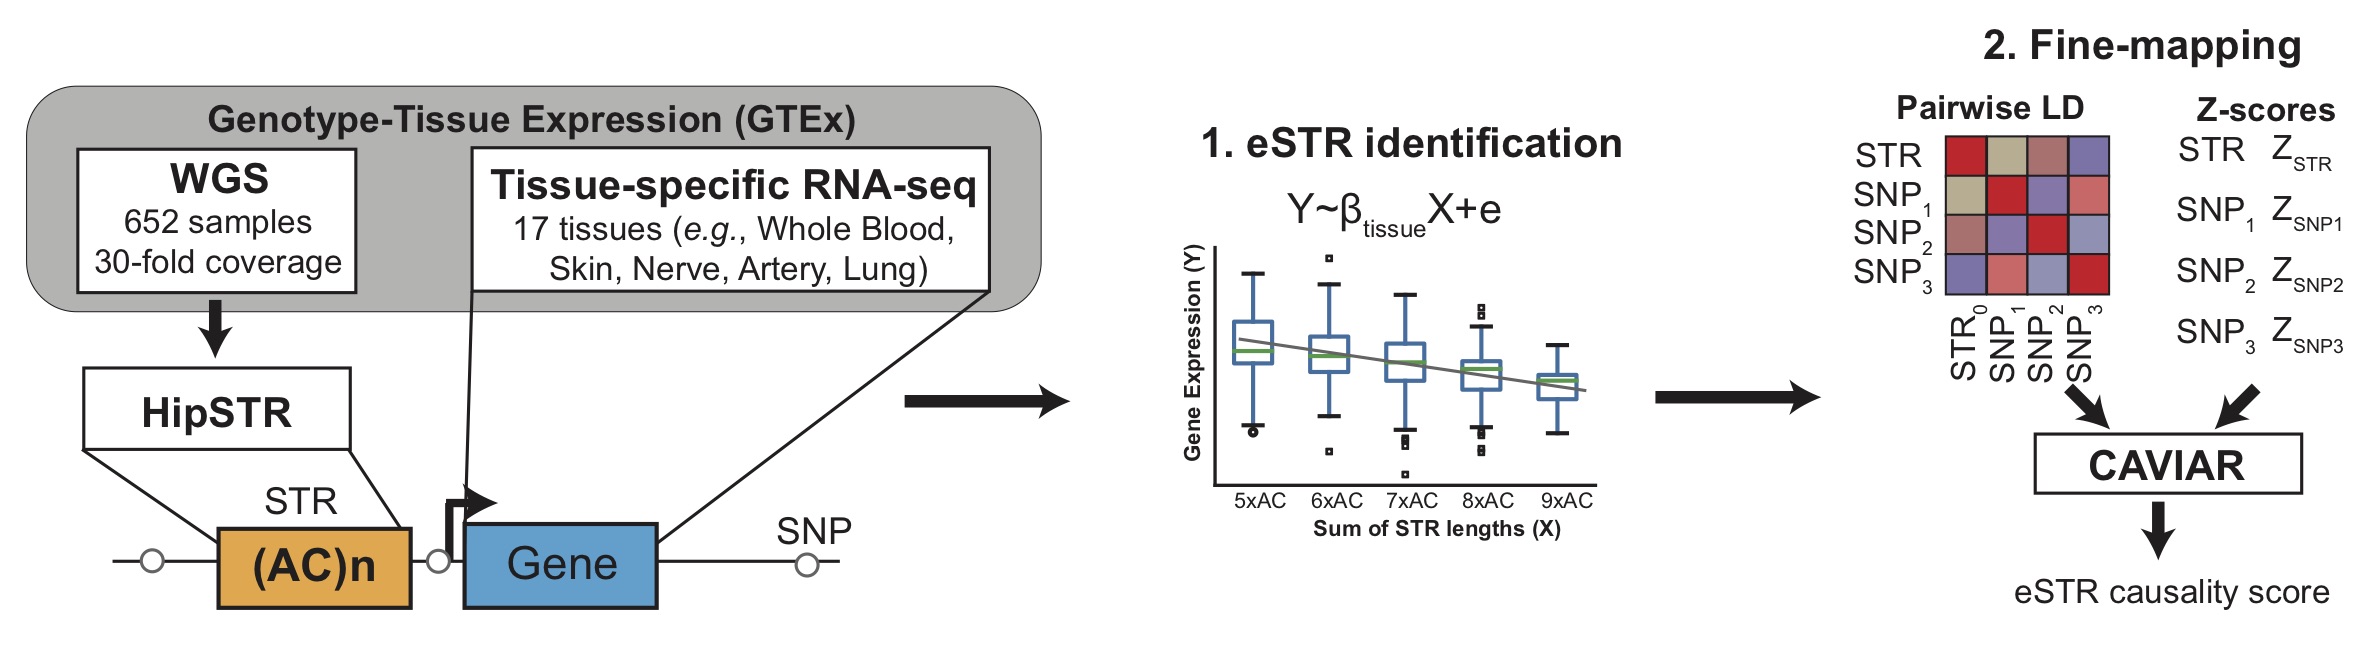
In this study we analyzed STRs in whole genome sequencing data from the Genotype Tissue Expression (GTEx) Project for 650 individuals and gene expression across 17 tissues to detect STRs whose lengths are correlated with expression of nearby genes (termed "eSTRs"). We further used CAVIAR to fine-map associations for individual genes against nearby SNPs to identify eSTRs most likely acting as causal variants. The figure below shows a schematic of the study design.
For each STR, all significant eSTRs (per-tissue gene-level FDR of 10%) are shown. The following statistics are given for each eSTR association:
- Gene (ENS): gives the gene name and Ensembl ID of the gene which the STR is associated with
- Tissue: the tissue where the association was identified. If a given eSTR was detected in multiple tissues, each tissue is shown on a separate line.
- Beta: the regression coefficient obtained by regression normalized gene expression values on normalized STR length. Positive beta values indicate longer STR lengths are associated with higher gene expression, and vice versa. Beta squared can be interpreted as the percentage of variance in gene expression explained by STR length.
- P-value: the p-value for the regression analysis, testing the null hypothesis that beta is equal to 0.
- CAVIAR: posterior probability of causality obtained by performing CAVIAR fine-mapping analysis against the top 100 nearby SNPs.
2. STR mutation rates and constraint (Gymrek et al. 2017)
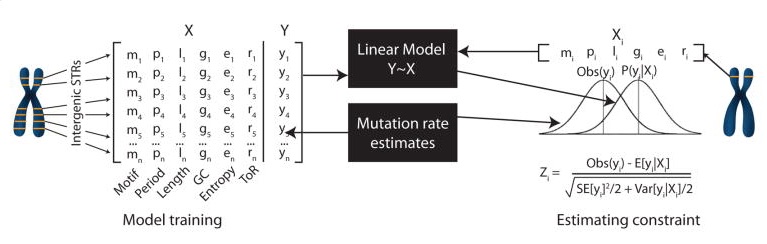
In this study we formulated a novel STR mutation model based on a mean-centered random walk and used this model to estimate key parameters of STR mutation at individual loci. We then used this model to compute per-STR estimates of mutational constraint by comparing observed to expected mutation rates at each STR. These constraint metrics can be used to prioritize potentially pathogenic variants. For example, mutations at highly constrained STRs (way lower observed mutation rate than expected) may be indicative of a pathogenic mutation.
The following data is shown for each STR. Notably, constraint scores were only computed for STRs with motif lengths 2 and 4, and some loci for which optimization of our likelihood model failed no mutation information is available.
-
Mutation model estimates:
- Mutation rate: per-locus per-generation probability of mutation
- Beta: Length constraint parameter (between 0 and 1; note different than the beta above for eSTRs). In general, short alleles are more likely to mutate to long alleles and vice versa. A beta value of 0 indicates no directional bias, whereas a value closer to 1 indicates a strong directional bias.
- P(single step): The probability that a mutation at this locus results in a length change of single repeat unit (as opposed to insertions or deletions of multiple copies of the repeat unit)
- Constraint: Z-score describing STR constraint. Negative values indicate strong constraint (lower mutation rates than expected). Positive values indicate hypermutable loci. Values near 0 indicate loci with mutation rates close to expected.
-
Stutter noise parameters: describe parameters of the stutter noise model at each STR inferred from PCR-free WGS.
- Up: probability that a stutter error results in an increase in repeat length
- Down: probability that a stutter error results in a decrease in repeat length
- P: probability that the size of a stutter error is a single repeat unit
3. Imputation statistics (Saini et al. 2018)
We generated a reference haplotype panel for imputing STR genotypes into SNP genotypes (either from WGS or from SNP arrays). The panel is based on WGS for quad families from the Simons Simplex Collection, which consists of individuals from various ancestry groups but is majority European and thus will have better performance for similar ancestry cohorts.

When available, the imputation metrics described below are available for each STR. These metrics give an overall picture of how well imputation of each STR will work across various ancestry groups.
Locus-level imputation metrics:
At each STR, we evaluated imputation performance by comparing genotypes obtained by HipSTR directly from WGS data vs. those obtained by imputation using our panel. Statistics shown are based on two types of evaluations. First, we performed a within-sample leave one out analysis (labeled as SSC). Second, we compared imputed vs. HipSTR genotypes in an orthogonal set of samples than those used to generate the panel (1000 Genomes, European, African, and East Asian cohorts). For each analysis, the following statistics are given:
- Concordance: the percentage of genotypes matching between those obtained directly by HipSTR vs. from imputation
- r: Pearson correlation between STR lengths obtained by HipSTR vs. by imputation.
- Allele: length of the STR allele, given in bp length difference from hg19
- r2: Pearson r2 between HipSTR vs. imputed genotypes.
- P-val: P-value testing the null hypothesis that the r2 value is 0
Shoutouts
First version of WebSTR was made by Richard Yanicky and Melissa Gymrek with input from other Gymrek Lab members. It was originally inspired by the Exome Aggregation Database now available in the in the gnomAD browser(ExAC). Current version of the website, database and the API is developed in collaboration with Maria Anisimova's Lab.
This collaboration project was supported by the SNSF Sinergia grant CRSII5_193832 and the EU Horizon 2020 research and innovation program under the Marie Skłodowska-Curie grant agreement No. 823886. Development of the first version of WebSTR was supported in part by the Office Of The Director, National Institutes of Health under Award Number DP5OD024577 and by SFARI Explorer Award Number 515568. Hosting, maintenance and development of WebSTR is partially funded by the NIH/NHGRI grant R01HG010885.